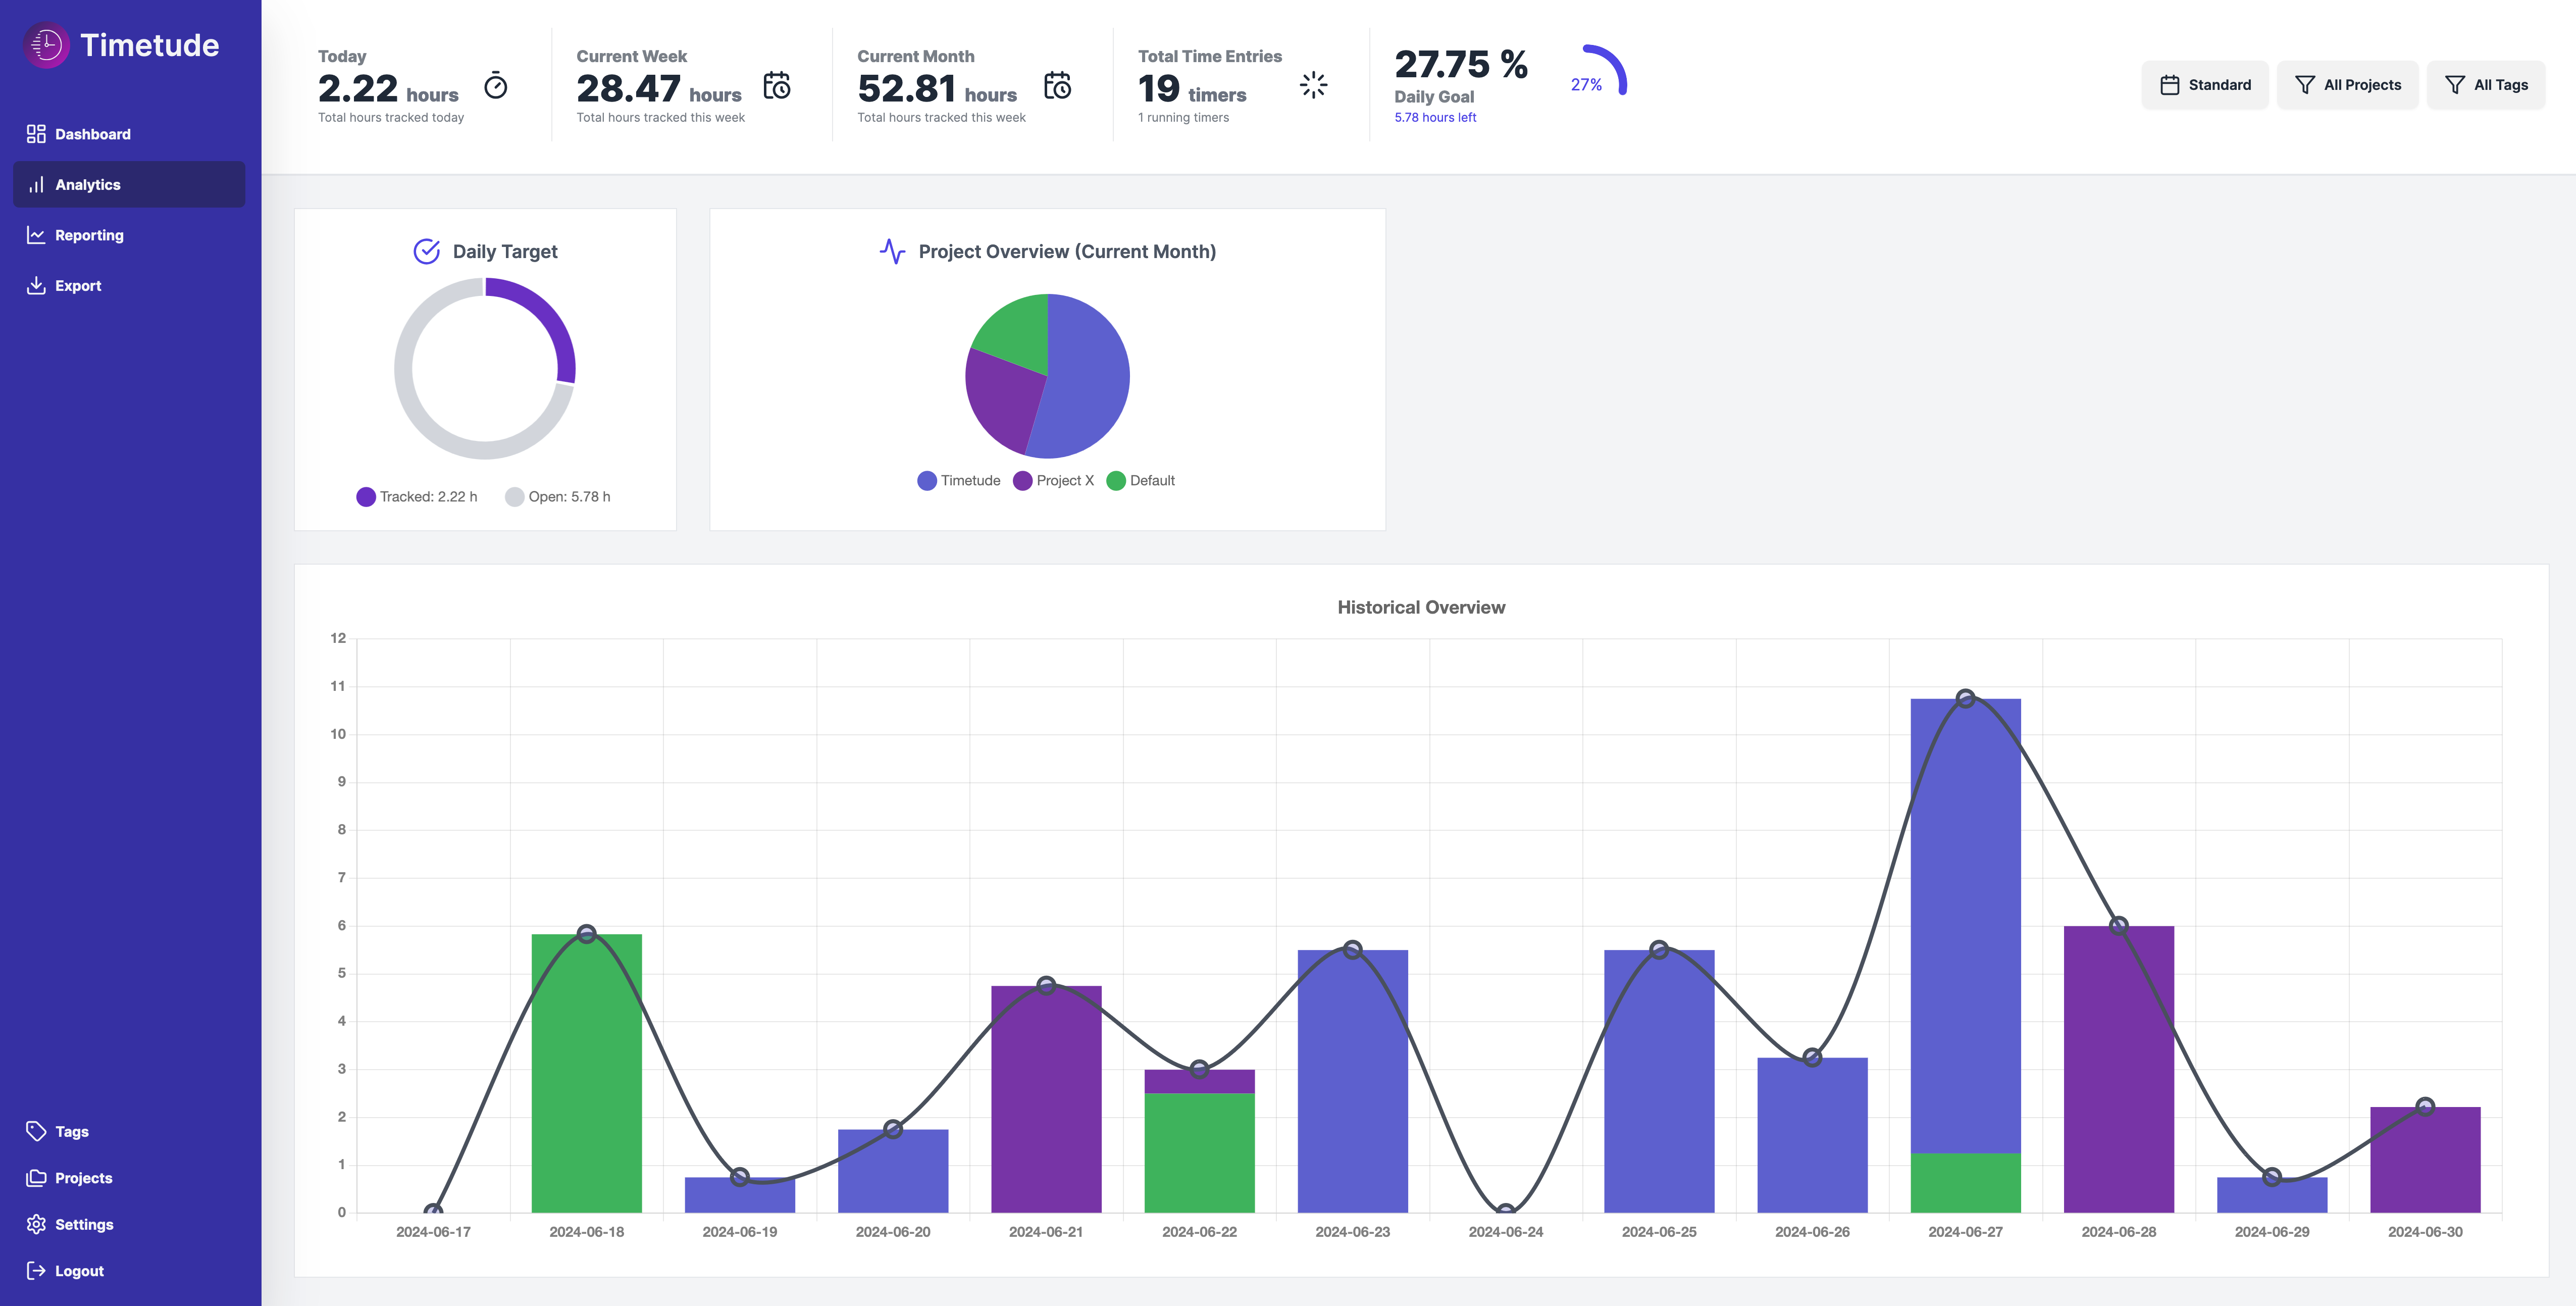
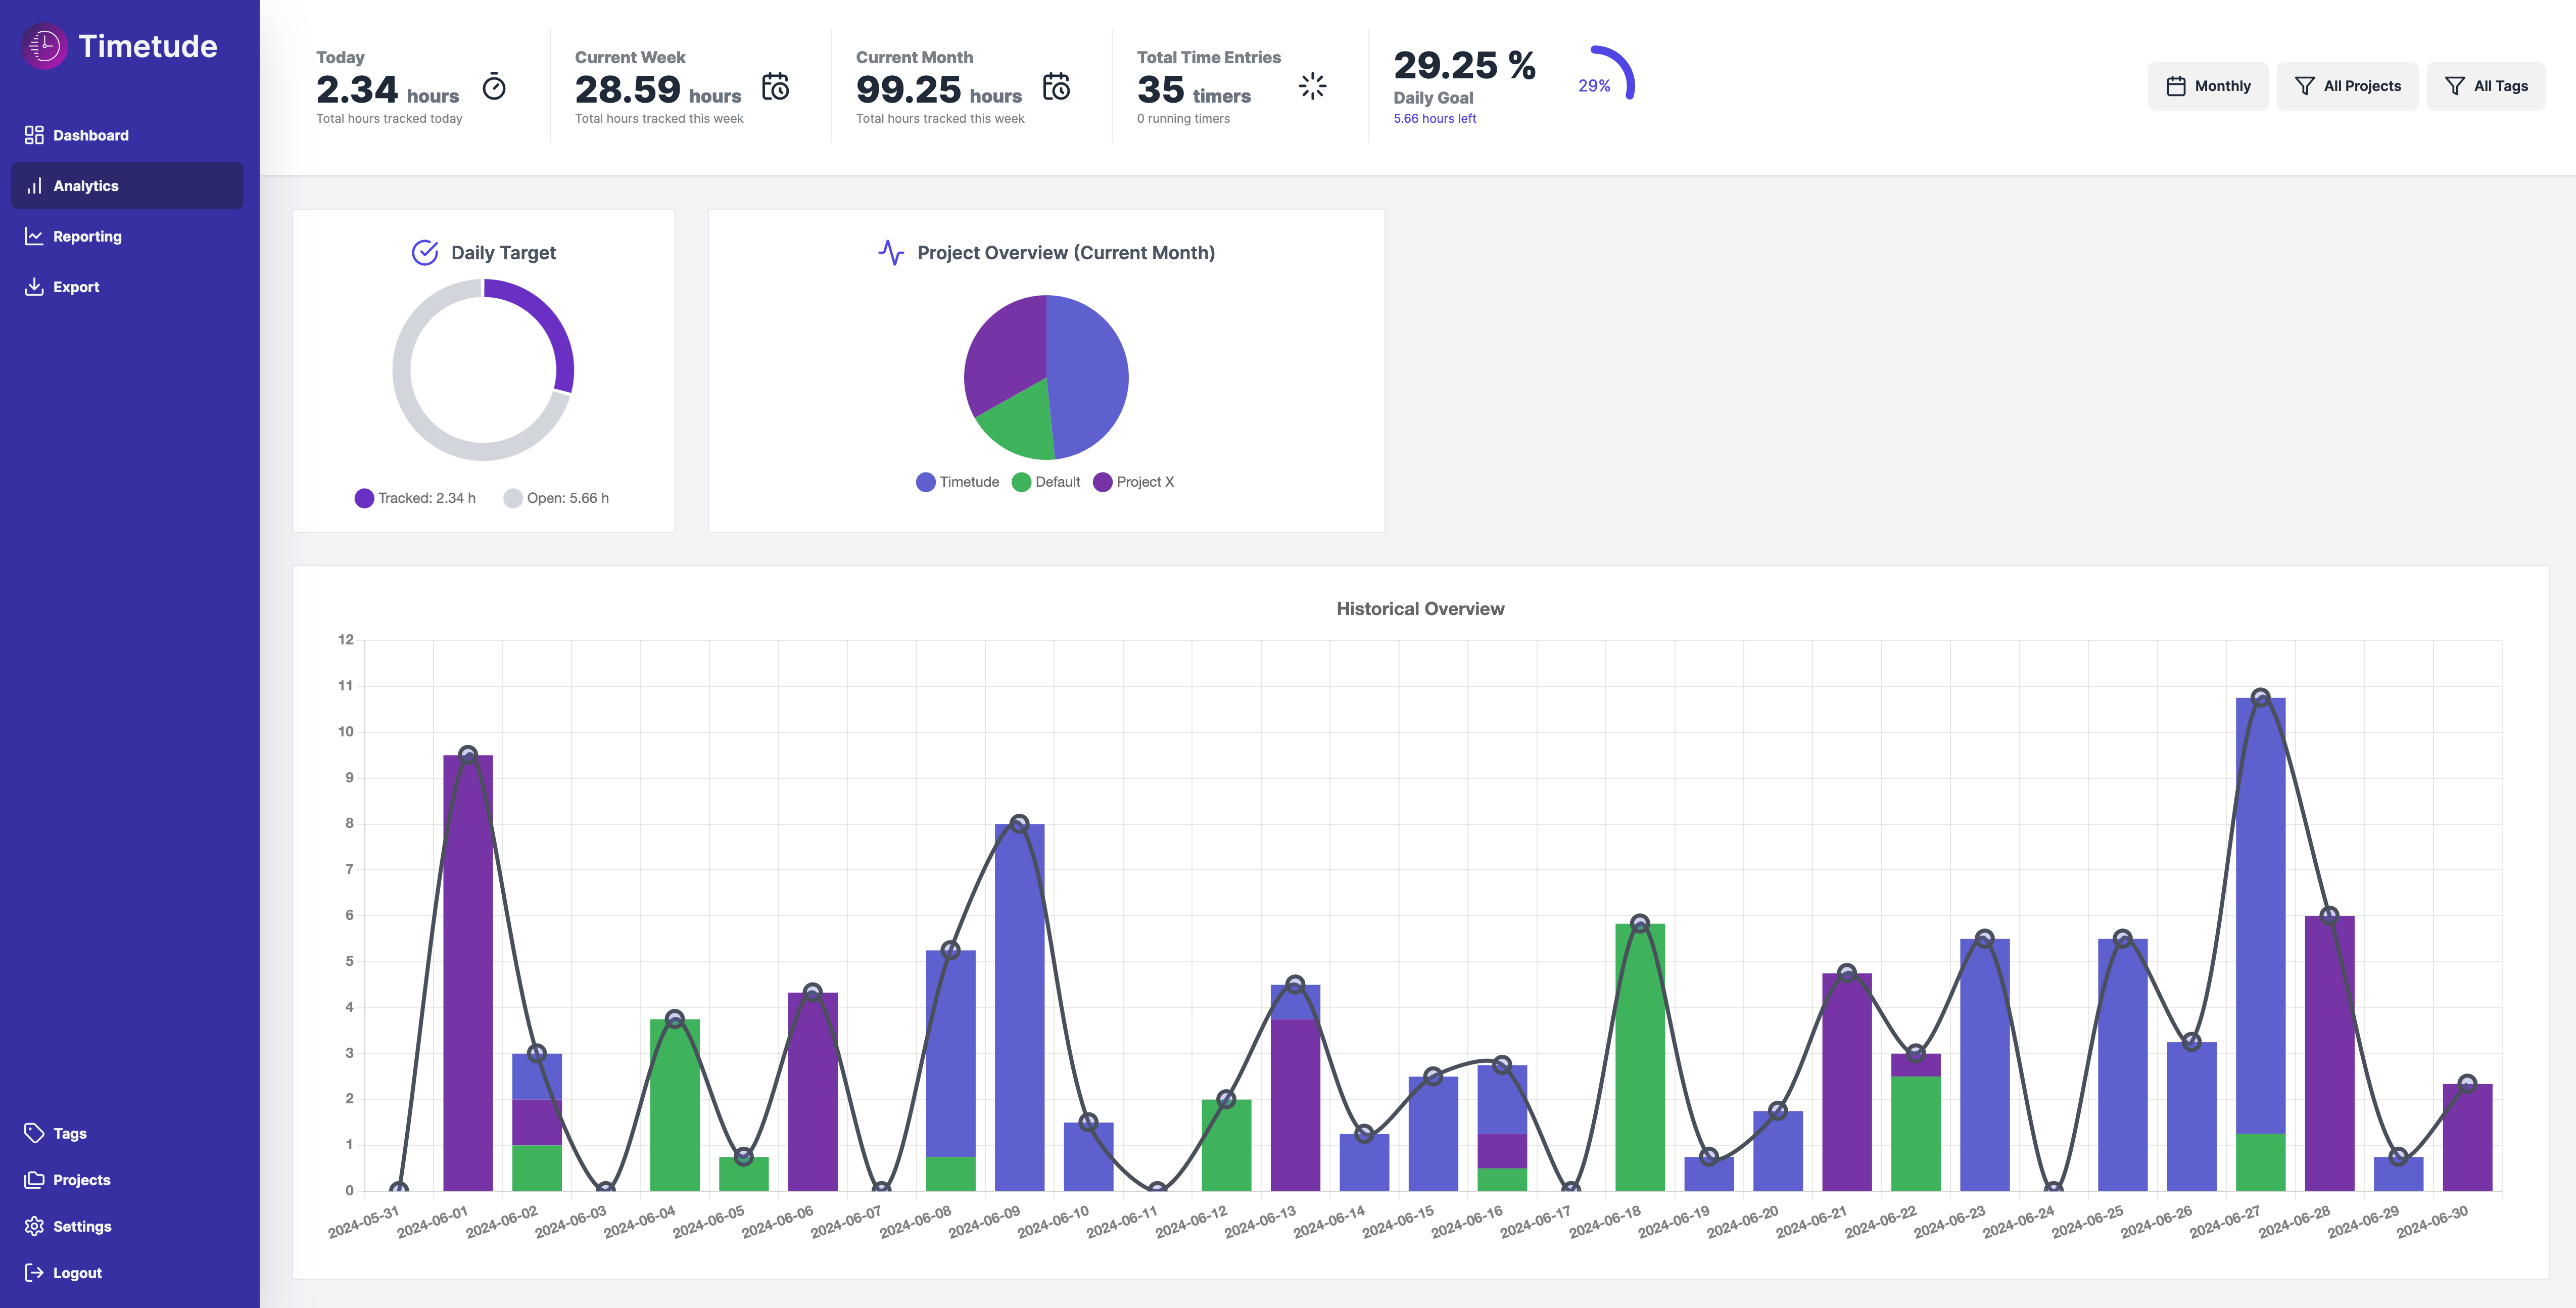
Historical Activity
The historical activity view of Timetude’s analytics dashboard enables you to visualize your performance in the past. You can choose from pre-defined time frames. Depending on the time frame you choose, the chart will change accordingly.
Standard
Monthly
Features
- Visualize yearly performance
- Standard (Last 14 Days)
- Monthly (Last Month)
- Yearly (Last Year)
- Identify peaks in your work load
- Total work hours per month
- Month-to-Month comparison
- Grouped by date and project
You might want to check out the weekly or daily overview as well.
Get Started
Want to experience the look and feel of Timetude’s time tracking tool yourself? Simply register an account.