Project Overview
The project overview of Timetude’s analytics dashboard enables you to visualize your project assignments of the current month.
Projects are one of the core features of Timetude to organize and categorize your time.
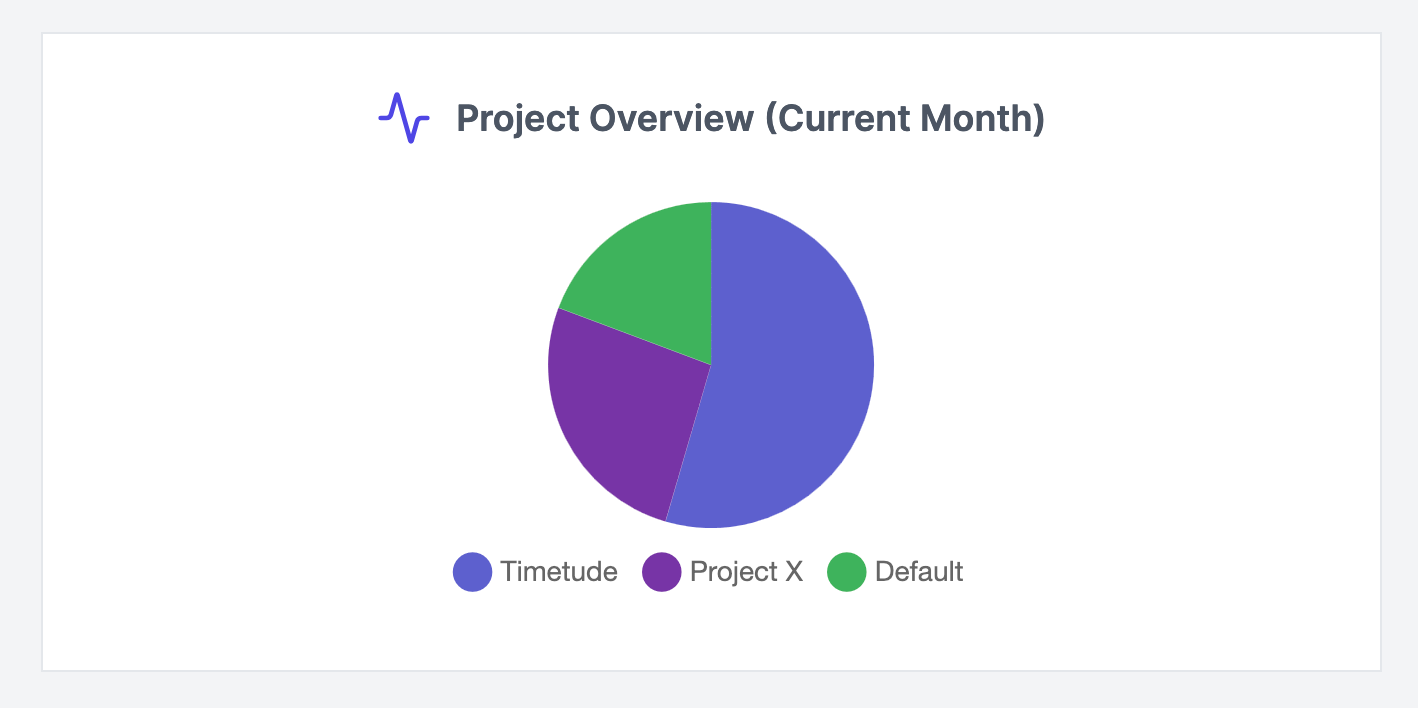
This report provides you with an overview of the projects you worked on in the current month. The projects are represented in the color you chose during the project creation. This chart helps you to visualize on which project you spent the most time. Hovering over the chart will provide you with further details.
Features
- Overview of current month
- Visualize project assignments
- Identify high volume projects
- Total hours worked per project
Change Projects
You can change your projects, e.g. name, description or color in the project settings.
Settings > Projects > Edit Project.
Get Started
Want to experience the look and feel of Timetude’s time tracking tool yourself? Simply register an account.